User Guide
Here is some examples to use ppr
1# Import the libary into your script
2import pypbireport as ppr
Report
1# Define the path for your report
2pbix_path = r'C:\Users\ismae\OneDrive\Projetos\py-powerbi-layout\Sample Report.pbix'
3
4# Instantiate a PBIReport object
5report = ppr.PBIReport(pbix_path=pbix_path)
6
7report
Sample Report: 3 pages and 15 visuals
Read PBI report json as a python dictionary
1# After reading a PBIX file, the layout JSON is in a dictionary
2foo = report.layout_pbi_dict
3
4print(f'Layout JSON in a dictionary: {type(foo)}')
5
6print(f'Number of keys and its names: {len(foo)}, {list(foo.keys())}')
Layout JSON in a dictionary: <class 'dict'>
Number of keys and its names: 6, ['id', 'theme', 'resourcePackages', 'sections', 'config', 'layoutOptimization']
1# For example, the key `sections` hold the pages of report
2# Get the number of pages
3print(len(foo.get('sections')))
4
5# Get the name of first page in report
6print(foo.get('sections')[0].get('displayName'))
3
Cover
Visuals
Visuals in report as a list of Visual objects
1# Visuals of the report
2report.visuals
[Visual( id: ba11b203b4ce6a5c7490 | page: Cover | hor,ver: (110,56) | h,w: (56, 318) | type: textbox ),
 Visual( id: dfb0ef76dbaad8215b35 | page: Cover | hor,ver: (110,97) | h,w: (14, 357) | type: shape ),
 Visual( id: 86673bea6b52652fd0e8 | page: Cover | hor,ver: (549,126) | h,w: (246, 180) | type: image ),
 Visual( id: 1c510b92f9664aa06f71 | page: Sales Reseller | hor,ver: (308,184) | h,w: (336, 676) | type: lineStackedColumnComboChart ),
 Visual( id: 74dc7d85aa39bf8a5880 | page: Sales Reseller | hor,ver: (92,82) | h,w: (48, 249) | type: textbox ),
 Visual( id: 2ea41ed9ed62c60aab33 | page: Sales Reseller | hor,ver: (324,184) | h,w: (336, 614) | type: hundredPercentStackedColumnChart ),
 BookmarkSlicer( id: 70ac771ab9b71818c964 | page: Sales Reseller | hor,ver: (308,135) | h,w: (29, 100) | type: bookmarkNavigator ),
 Visual( id: 3656b63a1c5a1d5864fb | page: Sales Geography | hor,ver: (201,207) | h,w: (345, 414) | type: clusteredBarChart ),
 Visual( id: b48b6690e2c83b1a4339 | page: Sales Geography | hor,ver: (31,17) | h,w: (48, 339) | type: textbox ),
 Visual( id: a60fd9caebd151edd61b | page: Sales Geography | hor,ver: (201,207) | h,w: (358, 420) | type: clusteredBarChart ),
 BookmarkSlicer( id: 07788b861426e801f4c7 | page: Sales Geography | hor,ver: (201,160) | h,w: (36, 220) | type: bookmarkNavigator ),
 Visual( id: 2caadbd8b53008045d2d | page: Sales Geography | hor,ver: (711,106) | h,w: (201, 363) | type: funnel ),
 Slicer( id: a6a4486f8508b0878304 | page: Sales Geography | hor,ver: (31,63) | h,w: (144, 121) | type: slicer ),
 Column( id: 1aaebe320ae9e89ac467 | page: Sales Geography | hor,ver: (637,308) | h,w: (243, 571) | type: columnChart ),
 Card( id: 1a35ebc8b0a047328cc4 | page: Sales Geography | hor,ver: (201,66) | h,w: (61, 147) | type: card )]
1# For make page division easy, there is a dictionary of visual list per page
2report.pages_visuals
{'Cover': [Visual( id: ba11b203b4ce6a5c7490 | page: Cover | hor,ver: (110,56) | h,w: (56, 318) | type: textbox ),
  Visual( id: dfb0ef76dbaad8215b35 | page: Cover | hor,ver: (110,97) | h,w: (14, 357) | type: shape ),
  Visual( id: 86673bea6b52652fd0e8 | page: Cover | hor,ver: (549,126) | h,w: (246, 180) | type: image )],
 'Sales Reseller': [Visual( id: 1c510b92f9664aa06f71 | page: Sales Reseller | hor,ver: (308,184) | h,w: (336, 676) | type: lineStackedColumnComboChart ),
  Visual( id: 74dc7d85aa39bf8a5880 | page: Sales Reseller | hor,ver: (92,82) | h,w: (48, 249) | type: textbox ),
  Visual( id: 2ea41ed9ed62c60aab33 | page: Sales Reseller | hor,ver: (324,184) | h,w: (336, 614) | type: hundredPercentStackedColumnChart ),
  BookmarkSlicer( id: 70ac771ab9b71818c964 | page: Sales Reseller | hor,ver: (308,135) | h,w: (29, 100) | type: bookmarkNavigator )],
 'Sales Geography': [Visual( id: 3656b63a1c5a1d5864fb | page: Sales Geography | hor,ver: (201,207) | h,w: (345, 414) | type: clusteredBarChart ),
  Visual( id: b48b6690e2c83b1a4339 | page: Sales Geography | hor,ver: (31,17) | h,w: (48, 339) | type: textbox ),
  Visual( id: a60fd9caebd151edd61b | page: Sales Geography | hor,ver: (201,207) | h,w: (358, 420) | type: clusteredBarChart ),
  BookmarkSlicer( id: 07788b861426e801f4c7 | page: Sales Geography | hor,ver: (201,160) | h,w: (36, 220) | type: bookmarkNavigator ),
  Visual( id: 2caadbd8b53008045d2d | page: Sales Geography | hor,ver: (711,106) | h,w: (201, 363) | type: funnel ),
  Slicer( id: a6a4486f8508b0878304 | page: Sales Geography | hor,ver: (31,63) | h,w: (144, 121) | type: slicer ),
  Column( id: 1aaebe320ae9e89ac467 | page: Sales Geography | hor,ver: (637,308) | h,w: (243, 571) | type: columnChart ),
  Card( id: 1a35ebc8b0a047328cc4 | page: Sales Geography | hor,ver: (201,66) | h,w: (61, 147) | type: card )]}
1# You can visualize the resume of visuals as a pandas dataframe
2report.resume_report_visuals()[['visualid', 'type', 'position', 'size']].head(5)
| visualid | type | position | size | |
|---|---|---|---|---|
| pagename | ||||
| Cover | ba11b203b4ce6a5c7490 | textbox | {'x': 110, 'y': 56} | {'width': 318, 'height': 56} |
| Cover | dfb0ef76dbaad8215b35 | shape | {'x': 110, 'y': 97} | {'width': 357, 'height': 14} |
| Cover | 86673bea6b52652fd0e8 | image | {'x': 549, 'y': 126} | {'width': 180, 'height': 246} |
| Sales Reseller | 1c510b92f9664aa06f71 | lineStackedColumnComboChart | {'x': 308, 'y': 184} | {'width': 676, 'height': 336} |
| Sales Reseller | 74dc7d85aa39bf8a5880 | textbox | {'x': 92, 'y': 82} | {'width': 249, 'height': 48} |
Visual Object
Visual Costumization
 1# Visual objects have their attributes and they can be modified
 2
 3# An example
 4visual = report.visuals[9]
 5print(f'Type of visual: {visual.visual_type}')
 6# Get information from visual
 7print(f'Vertical position: {visual.vertical}')
 8# Modify the vertical positon of visual and check
 9visual.vertical = 150
10print(f'New vertical position: {visual.vertical}')
Type of visual: clusteredBarChart
Vertical position: 207.2164948453608
New vertical position: 150
Modification throught visual dictionary
1# The visual attribute of Visual objects contains the dictonary that is
2# rendered in Power BI. So, all modification can be made directly in it.
3
4visual = report.visuals['b48b6690e2c83b1a4339'] #use id for slicing
5visual.visual
{'x': 31.546391752577318,
 'y': 17.31958762886598,
 'z': 1000,
 'width': 339.58762886597935,
 'height': 48.865979381443296,
 'config': {'name': 'b48b6690e2c83b1a4339',
  'layouts': [{'id': 0,
    'position': {'x': 31.546391752577318,
     'y': 17.31958762886598,
     'z': 1000,
     'width': 339.58762886597935,
     'height': 48.865979381443296,
     'tabOrder': 1000}}],
  'singleVisual': {'visualType': 'textbox',
   'drillFilterOtherVisuals': True,
   'objects': {'general': [{'properties': {'paragraphs': [{'textRuns': [{'value': 'Reseller Sales Geography Analysis',
           'textStyle': {'fontWeight': 'bold', 'fontSize': '16pt'}}]}]}}]}}},
 'filters': [],
 'tabOrder': 1000,
 'query': {},
 'dataTransforms': {}}
 1# For example, let's change the font size of text box
 2
 3# Get the value from visual dictionary and set new value for it
 4font_size = (
 5    visual.visual['config']['singleVisual']['objects']['general'][0]
 6    ['properties']['paragraphs'][0]['textRuns'][0]['textStyle']['fontSize']
 7)
 8print(f'Value of font size: {font_size}')
 9
10# Set new value throught dictonary
11(
12    visual.visual['config']['singleVisual']['objects']['general'][0]
13    ['properties']['paragraphs'][0]['textRuns'][0]['textStyle']['fontSize']
14) = '20pt'
15
16# Confering the new value
17font_size = (
18    visual.visual['config']['singleVisual']['objects']['general'][0]
19    ['properties']['paragraphs'][0]['textRuns'][0]['textStyle']['fontSize']
20)
21print(f'New value: {font_size}')
Value of font size: 16pt
New value: 20pt
1# The above dictionary can be made else with update method
2# For the same modification
3(
4    visual.visual['config']['singleVisual']['objects']['general'][0]
5    ['properties']['paragraphs'][0]['textRuns'][0]['textStyle']
6    .update({'fontSize':'20pt'})
7)
Adding a visual in report
For adding a new visual in the report, we have two option: get an existing or create a new from some template
Get an existing visual and create a copy
1# First, get an existing visual. Let's work with one specific page this time
2
3sg_visuals = report.pages_visuals['Sales Geography'] #remember that `pages_visuals` is a dictonary of pages_name:visual_list
4sg_visuals
[Visual( id: 3656b63a1c5a1d5864fb | page: Sales Geography | hor,ver: (201,207) | h,w: (345, 414) | type: clusteredBarChart ),
 Visual( id: b48b6690e2c83b1a4339 | page: Sales Geography | hor,ver: (31,17) | h,w: (48, 339) | type: textbox ),
 Visual( id: a60fd9caebd151edd61b | page: Sales Geography | hor,ver: (201,150) | h,w: (358, 420) | type: clusteredBarChart ),
 BookmarkSlicer( id: 07788b861426e801f4c7 | page: Sales Geography | hor,ver: (201,160) | h,w: (36, 220) | type: bookmarkNavigator ),
 Visual( id: 2caadbd8b53008045d2d | page: Sales Geography | hor,ver: (711,106) | h,w: (201, 363) | type: funnel ),
 Slicer( id: a6a4486f8508b0878304 | page: Sales Geography | hor,ver: (31,63) | h,w: (144, 121) | type: slicer ),
 Column( id: 1aaebe320ae9e89ac467 | page: Sales Geography | hor,ver: (637,308) | h,w: (243, 571) | type: columnChart ),
 Card( id: 1a35ebc8b0a047328cc4 | page: Sales Geography | hor,ver: (201,66) | h,w: (61, 147) | type: card )]
1# Get a card from the page
2visual_column = sg_visuals['1aaebe320ae9e89ac467']
3
4# See some properties
5print(f'The hexadecimal id: {visual_column.id}')
6print(f'The height: {visual_column.height}')
7print(f'The measure in y field: {visual_column.y}')
8print(f'The horizontal position: {visual_column.horizontal}')
The hexadecimal id: 1aaebe320ae9e89ac467
The height: 243.71134020618555
The measure in y field: Metrics.Sales
The horizontal position: 637.1134020618557
To create a copy of visual, use the function copy_visual
1import copy #libeary to deepcopy dictionary
2
3# Deepcopy the visual dictionary
4visual_column_copy = ppr.copy_visual(visual_column)
5
6visual_column_copy
Column( id: f4f7503e0699fef408f6 | page: | hor,ver: (637,308) | h,w: (243, 571) | type: columnChart )
1# Modfify some properties
2visual_column_copy.height = 200
3visual_column_copy.horizontal = 200
4visual_column_copy.vertical = 100
5
6print(f'The hexadecimal id: {visual_column_copy.id}') #this should be different
7print(f'The height: {visual_column_copy.height}')
8print(f'The measure in y field: {visual_column_copy.y}')
9print(f'The horizontal position: {visual_column_copy.horizontal}')
The hexadecimal id: f4f7503e0699fef408f6
The height: 200
The measure in y field: Metrics.Sales
The horizontal position: 200
The copied visual hasn’t a allocated page.
You should now to use the report insert_visual_in_page(page_name, visual) method for adding the visual.
1# Using the function `insert_visual_in_page` to add in a page
2report.insert_visual_in_page(page_name='Sales Geography', visual=visual_column_copy)
1# Checking visual in page
2report.pages_visuals['Sales Geography']
[Visual( id: 3656b63a1c5a1d5864fb | page: Sales Geography | hor,ver: (201,207) | h,w: (345, 414) | type: clusteredBarChart ),
 Visual( id: b48b6690e2c83b1a4339 | page: Sales Geography | hor,ver: (31,17) | h,w: (48, 339) | type: textbox ),
 Visual( id: a60fd9caebd151edd61b | page: Sales Geography | hor,ver: (201,150) | h,w: (358, 420) | type: clusteredBarChart ),
 BookmarkSlicer( id: 07788b861426e801f4c7 | page: Sales Geography | hor,ver: (201,160) | h,w: (36, 220) | type: bookmarkNavigator ),
 Visual( id: 2caadbd8b53008045d2d | page: Sales Geography | hor,ver: (711,106) | h,w: (201, 363) | type: funnel ),
 Slicer( id: a6a4486f8508b0878304 | page: Sales Geography | hor,ver: (31,63) | h,w: (144, 121) | type: slicer ),
 Column( id: 1aaebe320ae9e89ac467 | page: Sales Geography | hor,ver: (637,308) | h,w: (243, 571) | type: columnChart ),
 Card( id: 1a35ebc8b0a047328cc4 | page: Sales Geography | hor,ver: (201,66) | h,w: (61, 147) | type: card ),
 Column( id: f4f7503e0699fef408f6 | page: Sales Geography | hor,ver: (200,100) | h,w: (200, 571) | type: columnChart )]
The last one is the copy of column chart
Create a new visual from template
Use the fucntion create_new_visual(visual: ['card', 'column', 'slicer_drop', 'slicer_list', 'bookmark_slicer'], page_name, page_id)
The ppr provides 5 visual templates (‘card’, ‘column’, ‘slicer_drop’, ‘slicer_list’, ‘bookmark_slicer’).
There are simple preset visual dictionary placed inside package to ease the visual creation.
Besides it, maybe a copy of created visual would be more suitable.
1# Diffent from previous copy, that a copy is made without a page, for new visual
2# you should determine its location.
3# To get the page_id, use report function resume_report_pages()
4report.resume_report_pages()
{0: ['Cover', 'ReportSection'],
 1: ['Sales Reseller', 'ReportSectione5a5d9f92de0fef7e45e'],
 2: ['Sales Geography', 'ReportSectionbe016ac3584b5b3bef65']}
1# Let's crate a card visual in Sales Geography
2card = ppr.create_new_visual(visual='card',
3                             page_name='Sales Geography',
4                             page_id='ReportSectionbe016ac3584b5b3bef65')
5
6card
Card( id: 2dfcb5e4d7b6264b717d | page: Sales Geography | hor,ver: (164,233) | h,w: (68, 172) | type: card )
Important: the fact that created visual has a assigned page doesn’t mean that it is inserted into report.
1# Again, you are free to modified and costumize the visual before insertion
2# into report.
3card.title_text = "PPR Card created"
4card.height = 10
5card.horizontal = 100
6
7report.insert_visual_in_page(page_name='Sales Geography', visual=card)
1# Check if visual was added
2report.pages_visuals['Sales Geography']
[Visual( id: 3656b63a1c5a1d5864fb | page: Sales Geography | hor,ver: (201,207) | h,w: (345, 414) | type: clusteredBarChart ),
 Visual( id: b48b6690e2c83b1a4339 | page: Sales Geography | hor,ver: (31,17) | h,w: (48, 339) | type: textbox ),
 Visual( id: a60fd9caebd151edd61b | page: Sales Geography | hor,ver: (201,150) | h,w: (358, 420) | type: clusteredBarChart ),
 BookmarkSlicer( id: 07788b861426e801f4c7 | page: Sales Geography | hor,ver: (201,160) | h,w: (36, 220) | type: bookmarkNavigator ),
 Visual( id: 2caadbd8b53008045d2d | page: Sales Geography | hor,ver: (711,106) | h,w: (201, 363) | type: funnel ),
 Slicer( id: a6a4486f8508b0878304 | page: Sales Geography | hor,ver: (31,63) | h,w: (144, 121) | type: slicer ),
 Column( id: 1aaebe320ae9e89ac467 | page: Sales Geography | hor,ver: (637,308) | h,w: (243, 571) | type: columnChart ),
 Card( id: 1a35ebc8b0a047328cc4 | page: Sales Geography | hor,ver: (201,66) | h,w: (61, 147) | type: card ),
 Column( id: f4f7503e0699fef408f6 | page: Sales Geography | hor,ver: (200,100) | h,w: (200, 571) | type: columnChart ),
 Card( id: 2dfcb5e4d7b6264b717d | page: Sales Geography | hor,ver: (100,233) | h,w: (10, 172) | type: card )]
Bookmarks
Bookmarks information
1# Resume bookmarks in the report
2report.bookmarks
[Bookmark( id: 'Bookmark0ed6bff31aa9b8bd1871' | name: City | page: Sales Geography | show: ['3656b63a1c5a1d5864fb', 'b48b6690e2c83b1a4339', '07788b861426e801f4c7'] | hide: ['a60fd9caebd151edd61b'] ),
 Bookmark( id: 'Bookmark84f5abdb65c08d899418' | name: Country | page: Sales Geography | show: ['b48b6690e2c83b1a4339', 'a60fd9caebd151edd61b', '07788b861426e801f4c7'] | hide: ['3656b63a1c5a1d5864fb'] ),
 Bookmark( id: 'Bookmark5fa4a86292cd8509f1a7' | name: V | page: Sales Reseller | show: ['1c510b92f9664aa06f71', '74dc7d85aa39bf8a5880'] | hide: ['2ea41ed9ed62c60aab33'] ),
 Bookmark( id: 'Bookmark549dfb51b281266458c9' | name: P | page: Sales Reseller | show: ['74dc7d85aa39bf8a5880', '2ea41ed9ed62c60aab33'] | hide: ['1c510b92f9664aa06f71'] ),
 Bookmark( id: 'Bookmarkbeef068b5ca61ec2a331' | name: Botao Solto | page: Sales Geography | show: ['07788b861426e801f4c7'] | hide: ['3656b63a1c5a1d5864fb', 'b48b6690e2c83b1a4339', 'a60fd9caebd151edd61b'] )]
1# Resume bookmarks groups in the report
2report.bookmark_groups
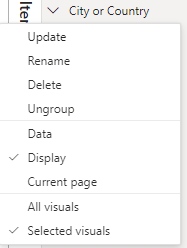
[BookmarkGroup( id: 'Bookmark3a33e033c4557e665f3b' | name: City or Country | page: Sales Geography | bookmarks_id: ['Bookmark0ed6bff31aa9b8bd1871', 'Bookmark84f5abdb65c08d899418'] | bookmarks_name: ['City', 'Country'] | visuals: ['3656b63a1c5a1d5864fb', 'b48b6690e2c83b1a4339', '07788b861426e801f4c7', 'a60fd9caebd151edd61b', 'b48b6690e2c83b1a4339', 'a60fd9caebd151edd61b', '07788b861426e801f4c7', '3656b63a1c5a1d5864fb'] ),
 BookmarkGroup( id: 'Bookmark788448a1069d01cbd063' | name: V, P | page: Sales Reseller | bookmarks_id: ['Bookmark5fa4a86292cd8509f1a7', 'Bookmark549dfb51b281266458c9'] | bookmarks_name: ['V', 'P'] | visuals: ['1c510b92f9664aa06f71', '74dc7d85aa39bf8a5880', '2ea41ed9ed62c60aab33', '74dc7d85aa39bf8a5880', '2ea41ed9ed62c60aab33', '1c510b92f9664aa06f71'] )]
1# The bookmarks hasn't specfic page.
2# Get a bookmark
3book = report.bookmarks[0]
4
5print(f'The bookmark id: {book.id}')
6print(f'Name: {book.name}')
7print(f'The to show visuals list: {book.show_visuals}')
8print(f'The hide one: {book.hide_visuals}')
The bookmark id: Bookmark0ed6bff31aa9b8bd1871
Name: City
The to show visuals list: [Visual( id: 3656b63a1c5a1d5864fb | page: Sales Geography | hor,ver: (201,207) | h,w: (345, 414) | type: clusteredBarChart ), Visual( id: b48b6690e2c83b1a4339 | page: Sales Geography | hor,ver: (31,17) | h,w: (48, 339) | type: textbox ), BookmarkSlicer( id: 07788b861426e801f4c7 | page: Sales Geography | hor,ver: (201,160) | h,w: (36, 220) | type: bookmarkNavigator )]
The hide one: [Visual( id: a60fd9caebd151edd61b | page: Sales Geography | hor,ver: (201,150) | h,w: (358, 420) | type: clusteredBarChart )]
1# Bookmark groups are collection of bookmarks
2book_group = report.bookmark_groups[0]
3
4print(f'The bookmark id: {book_group.id}')
5print(f'The name: {book_group.bookmark_group_name}')
6print(f'The bookmarks: {book_group.children_list}')
The bookmark id: Bookmark3a33e033c4557e665f3b
The name: City or Country
The bookmarks: [Bookmark( id: 'Bookmark0ed6bff31aa9b8bd1871' | name: City | page: Sales Geography | show: ['3656b63a1c5a1d5864fb', 'b48b6690e2c83b1a4339', '07788b861426e801f4c7'] | hide: ['a60fd9caebd151edd61b'] ), Bookmark( id: 'Bookmark84f5abdb65c08d899418' | name: Country | page: Sales Geography | show: ['b48b6690e2c83b1a4339', 'a60fd9caebd151edd61b', '07788b861426e801f4c7'] | hide: ['3656b63a1c5a1d5864fb'] )]
Important to note: the development for bookmarks was focused in “buttons” to show and hide visuals in the report.
Beging more specific, the intution is to work with preconfigured bookmarks:
It is not garrantee that package works fine with others bookmarks.
This is because there’re the attributes of show_visuals and hide_visuals. Nothing was thinking for “show page”, for example.
Create a bookmark using Bookmark object
 1# Remember that the bookmakr is for "buttons", so, first we need visuals to show
 2# and to hide
 3
 4to_show = (
 5    report.pages_visuals['Sales Geography']
 6    [['3656b63a1c5a1d5864fb', '2caadbd8b53008045d2d']] #pass a list of id of visuals
 7)
 8
 9to_hide = (
10    report.pages_visuals['Sales Geography']
11    [['a60fd9caebd151edd61b', '1aaebe320ae9e89ac467']] #pass a list of id of visuals
12)
13
14print(f'List of visual to show: {to_show}')
15print(f'List of visual to hide: {to_hide}')
List of visual to show: [Visual( id: 3656b63a1c5a1d5864fb | page: Sales Geography | hor,ver: (201,207) | h,w: (345, 414) | type: clusteredBarChart ), Visual( id: 2caadbd8b53008045d2d | page: Sales Geography | hor,ver: (711,106) | h,w: (201, 363) | type: funnel )]
List of visual to hide: [Visual( id: a60fd9caebd151edd61b | page: Sales Geography | hor,ver: (201,150) | h,w: (358, 420) | type: clusteredBarChart ), Column( id: 1aaebe320ae9e89ac467 | page: Sales Geography | hor,ver: (637,308) | h,w: (243, 571) | type: columnChart )]
1# Afte get the list of visuals, pass it as argument of a Bookmark
2button_a = ppr.Bookmark(bookmark_name='Button A',
3                        show_visuals=to_show,
4                        hide_visuals=to_hide)
5
6button_a
Bookmark( id: 'Bookmark9ac956de5511231f7b98' | name: Button A | page: Sales Geography | show: ['3656b63a1c5a1d5864fb', '2caadbd8b53008045d2d'] | hide: ['a60fd9caebd151edd61b', '1aaebe320ae9e89ac467'] )
Insert the bookmark using insert_bookmark(ppr_bookmark)
1# This is only only bookmark that shows the barchart and pie chart and hides
2# the other bar chart and the column chart.
3# After creation, you should add it to report
4
5report.insert_bookmark(ppr_bookmark=button_a)
1# Check if it was added
2report.bookmarks
[Bookmark( id: 'Bookmark0ed6bff31aa9b8bd1871' | name: City | page: Sales Geography | show: ['3656b63a1c5a1d5864fb', 'b48b6690e2c83b1a4339', '07788b861426e801f4c7'] | hide: ['a60fd9caebd151edd61b'] ),
 Bookmark( id: 'Bookmark84f5abdb65c08d899418' | name: Country | page: Sales Geography | show: ['b48b6690e2c83b1a4339', 'a60fd9caebd151edd61b', '07788b861426e801f4c7'] | hide: ['3656b63a1c5a1d5864fb'] ),
 Bookmark( id: 'Bookmark5fa4a86292cd8509f1a7' | name: V | page: Sales Reseller | show: ['1c510b92f9664aa06f71', '74dc7d85aa39bf8a5880'] | hide: ['2ea41ed9ed62c60aab33'] ),
 Bookmark( id: 'Bookmark549dfb51b281266458c9' | name: P | page: Sales Reseller | show: ['74dc7d85aa39bf8a5880', '2ea41ed9ed62c60aab33'] | hide: ['1c510b92f9664aa06f71'] ),
 Bookmark( id: 'Bookmarkbeef068b5ca61ec2a331' | name: Botao Solto | page: Sales Geography | show: ['07788b861426e801f4c7'] | hide: ['3656b63a1c5a1d5864fb', 'b48b6690e2c83b1a4339', 'a60fd9caebd151edd61b'] ),
 Bookmark( id: 'Bookmark9ac956de5511231f7b98' | name: Button A | page: Sales Geography | show: ['3656b63a1c5a1d5864fb', '2caadbd8b53008045d2d'] | hide: ['a60fd9caebd151edd61b', '1aaebe320ae9e89ac467'] )]
1# It was just one button. If we desire to create the oposite behaivor
2button_b = ppr.Bookmark(bookmark_name='Button A',
3                        show_visuals=to_hide,
4                        hide_visuals=to_show)
5
6button_b
Bookmark( id: 'Bookmarkffd731150f096fc83688' | name: Button A | page: Sales Geography | show: ['a60fd9caebd151edd61b', '1aaebe320ae9e89ac467'] | hide: ['3656b63a1c5a1d5864fb', '2caadbd8b53008045d2d'] )
Create a bookmark groups using BookmarkGroup object
1# With two bookmarks, we can create a bookmark group
2
3book_group = ppr.BookmarkGroup(bookmark_group_name='Buttons A and B',
4                               children_list=[button_a, button_b])
5
6book_group
BookmarkGroup( id: 'Bookmarka2546ca0183160ebe98b' | name: Buttons A and B | page: Sales Geography | bookmarks_id: ['Bookmark9ac956de5511231f7b98', 'Bookmarkffd731150f096fc83688'] | bookmarks_name: ['Button A', 'Button A'] | visuals: ['3656b63a1c5a1d5864fb', '2caadbd8b53008045d2d', 'a60fd9caebd151edd61b', '1aaebe320ae9e89ac467', 'a60fd9caebd151edd61b', '1aaebe320ae9e89ac467', '3656b63a1c5a1d5864fb', '2caadbd8b53008045d2d'] )
1# Bookmarks groups are inserted as bookmarks
2report.insert_bookmark(book_group)
1report.bookmark_groups
[BookmarkGroup( id: 'Bookmark3a33e033c4557e665f3b' | name: City or Country | page: Sales Geography | bookmarks_id: ['Bookmark0ed6bff31aa9b8bd1871', 'Bookmark84f5abdb65c08d899418'] | bookmarks_name: ['City', 'Country'] | visuals: ['3656b63a1c5a1d5864fb', 'b48b6690e2c83b1a4339', '07788b861426e801f4c7', 'a60fd9caebd151edd61b', 'b48b6690e2c83b1a4339', 'a60fd9caebd151edd61b', '07788b861426e801f4c7', '3656b63a1c5a1d5864fb'] ),
 BookmarkGroup( id: 'Bookmark788448a1069d01cbd063' | name: V, P | page: Sales Reseller | bookmarks_id: ['Bookmark5fa4a86292cd8509f1a7', 'Bookmark549dfb51b281266458c9'] | bookmarks_name: ['V', 'P'] | visuals: ['1c510b92f9664aa06f71', '74dc7d85aa39bf8a5880', '2ea41ed9ed62c60aab33', '74dc7d85aa39bf8a5880', '2ea41ed9ed62c60aab33', '1c510b92f9664aa06f71'] ),
 BookmarkGroup( id: 'Bookmarka2546ca0183160ebe98b' | name: Buttons A and B | page: Sales Geography | bookmarks_id: ['Bookmark9ac956de5511231f7b98', 'Bookmarkffd731150f096fc83688'] | bookmarks_name: ['Button A', 'Button A'] | visuals: ['3656b63a1c5a1d5864fb', '2caadbd8b53008045d2d', 'a60fd9caebd151edd61b', '1aaebe320ae9e89ac467', 'a60fd9caebd151edd61b', '1aaebe320ae9e89ac467', '3656b63a1c5a1d5864fb', '2caadbd8b53008045d2d'] )]
Adding a Bookmark Navigator
1# Combine with visuals and add a bookmark navigator to report
2
3bookmark_nav = ppr.create_new_visual(visual='bookmark_slicer',
4                                     page_name='Sales Geography',
5                                     page_id='ReportSectionbe016ac3584b5b3bef65')
6
7bookmark_nav
BookmarkSlicer( id: 8351f541bb0562e4b87d | page: Sales Geography | hor,ver: (493,118) | h,w: (49, 259) | type: bookmarkNavigator )
1# Add the bookamrks group for selection
2bookmark_nav.bookmark_group = f"'{book_group.id}'"
3
4bookmark_nav.bookmark_group
"'Bookmarka2546ca0183160ebe98b'"
Important note: this syntax of “’id’” is necessary to work inside Power BI
1# Finally, insert this into report.
2
3
4report.insert_visual_in_page(page_name='Sales Geography', visual=bookmark_nav)
1report.pages_visuals['Sales Geography']
[Visual( id: 3656b63a1c5a1d5864fb | page: Sales Geography | hor,ver: (201,207) | h,w: (345, 414) | type: clusteredBarChart ),
 Visual( id: b48b6690e2c83b1a4339 | page: Sales Geography | hor,ver: (31,17) | h,w: (48, 339) | type: textbox ),
 Visual( id: a60fd9caebd151edd61b | page: Sales Geography | hor,ver: (201,150) | h,w: (358, 420) | type: clusteredBarChart ),
 BookmarkSlicer( id: 07788b861426e801f4c7 | page: Sales Geography | hor,ver: (201,160) | h,w: (36, 220) | type: bookmarkNavigator ),
 Visual( id: 2caadbd8b53008045d2d | page: Sales Geography | hor,ver: (711,106) | h,w: (201, 363) | type: funnel ),
 Slicer( id: a6a4486f8508b0878304 | page: Sales Geography | hor,ver: (31,63) | h,w: (144, 121) | type: slicer ),
 Column( id: 1aaebe320ae9e89ac467 | page: Sales Geography | hor,ver: (637,308) | h,w: (243, 571) | type: columnChart ),
 Card( id: 1a35ebc8b0a047328cc4 | page: Sales Geography | hor,ver: (201,66) | h,w: (61, 147) | type: card ),
 Column( id: f4f7503e0699fef408f6 | page: Sales Geography | hor,ver: (200,100) | h,w: (200, 571) | type: columnChart ),
 Card( id: 2dfcb5e4d7b6264b717d | page: Sales Geography | hor,ver: (100,233) | h,w: (10, 172) | type: card ),
 BookmarkSlicer( id: 8351f541bb0562e4b87d | page: Sales Geography | hor,ver: (493,118) | h,w: (49, 259) | type: bookmarkNavigator )]
Save changes as a new report
Use function save_report of report to save the modification and consolidate the changes into a new file.
1# After this, we can save the changes in a new file
2report.save_report(file_name='Sample Report Edited.pbix')
Model
Power BI model only exists when file is opened. So, every code here consider that a Power BI file is opened.
Defining the model
1# Use PBIModel to define the model objects
2model = ppr.PBIModel('Sample Report.pbix') #the arg is the path of pbix file
Model information
1# Get some information from model
2
3print(f'The port of report is: {model.port_number}')
4print(f'Tables of the model: {model.tables}')
5print(f'Tabular model object: {model.model}')
The port of report is: 62688
Tables of the model: ['SalesTerritory', 'SalesOrder', 'Sales', 'Reseller', 'Product', 'Date', 'Customer', 'Metrics']
Tabular model object: Microsoft.AnalysisServices.Tabular.Model
When initiated, all tables are scaned and turned attributes as well its columns and measures.
Tables attributes initiate with t_. Columns with c_ and measures with m_.
Being aware that the name of attributes is quitly diffent measure name, because caracters probihition.
1# Explorer tables, columns and measures attributes
2print(f'Metrics table: {model.t_metrics}')
3print(f'Sales metric: {model.t_metrics.m_sales}')
4
5print(f'Costumer table: {model.t_customer}')
6print(f'Costumer ID column: {model.t_customer.c_customer_id}')
Metrics table: 'Metrics'
Sales metric: 'Metrics'[Sales]
Costumer table: 'Customer'
Costumer ID column: 'Customer'[Customer ID]
 1# Some attributes of columns
 2print(f'The table of the column: {model.t_customer.c_customer_id.table_name}')
 3print(f'The qualified name: {model.t_customer.c_customer_id.qualified_name}')
 4print(f'The string for fields: {model.t_customer.c_customer_id.field_name}')
 5print('\n')
 6
 7# Some attributes of measure
 8print(f'The table of the measure: {model.t_metrics.m_sales.table_name}')
 9print(f'The qualified name: {model.t_metrics.m_sales.qualified_name}')
10print(f'The string for fields: {model.t_metrics.m_sales.visual_field_name}')
11print(f'The DAX formula: {model.t_metrics.m_sales.dax}')
The table of the column: Customer
The qualified name: 'Customer'[Customer ID]
The string for fields: Customer.Customer ID


The table of the measure: Metrics
The qualified name: 'Metrics'[Sales]
The string for fields: Metrics.Sales
The DAX formula: SUM(Sales[Sales Amount])
There are fuctions to resume the measures and the tables and columns. The return of theses function are pandas dataframe.
1# Resume measures dataframe
2model.resume_measures().head().iloc[:,:3]
| Description | Data type | Expression | |||
|---|---|---|---|---|---|
| Table Name | Number of Measures | Measure Name | |||
| Metrics | 4 | Sales | Created with ppr | Double | SUM(Sales[Sales Amount]) |
| Sales in Europe | Sales for Europe region | Double | \nCALCULATE ( [Sales], SalesTerritory[Group] =... | ||
| Sales YTD | The accumulation of Sales in the year. | Double | TOTALYTD( [Sales], 'Date'[Date] ) | ||
| Sales MTD | The accumulation of Sales inside month. | Double | TOTALMTD( [Sales], 'Date'[Date] ) |
1# Resume table and columns dataframe
2model.resume_tables_and_columns().head().iloc[:,:4]
| Description | Data type | Format string | Sort by column | |||
|---|---|---|---|---|---|---|
| Table Name | Number of Columns | Column Name | ||||
| SalesTerritory | 5 | RowNumber-2662979B-1795-4F74-8F37-6A1BA8059B61 | Int64 | None | ||
| SalesTerritoryKey | Int64 | 0 | None | |||
| Region | String | None | ||||
| Country | String | None | ||||
| Group | String | None |
Add a measure in model using add_measure_in_model
I believe one most great benefits of PPRModel is the possibility to add measures to the Power BI model using python.
It can be considere an alternative for Tabular Editor scritps. There, for iterations and other complicated action you should know C. Here, use python.
To begin, three arguments are necessary to add a measure: the table name, the name and the expression
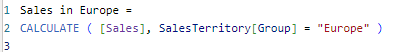
1# First, let's create the measure
2name = 'Sales in Europe'
3expression = '''
4CALCULATE ( [Sales], SalesTerritory[Group] = "Europe" )
5'''
6
7# So, use the function to add into `metrics` table
8model.add_measure_in_model(table_name='Metrics', name=name,
9                           expression=expression)
Measure Sales in Europe was added in table Metrics in the model
As it run, the measure is added directly to Power BI.
Besides the name and the expression, format string, display folder and description can be passed to function.
The other important argument of function is if_exists. If measure already exists in the model, a warn is returned. If you are sure that measure can be overwriten, then set if_exists to ‘delete’
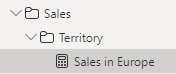
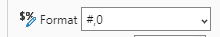
 1# Define the format string, description and folder of the measure
 2format_string = '#,0'
 3description = 'Sales for Europe region'
 4display_folder = r'Sales\Territory'
 5
 6# Add to model
 7model.add_measure_in_model(table_name='Metrics', name=name,
 8                           expression=expression, format_string=format_string,
 9                           description=description,
10                           display_folder=display_folder, if_exists='delete')
Measure Sales in Europe was added in table Metrics in the model
The folder is created and format is as we set.
With this function, you can add a batch of measures in a loop inside python or use a external file, like Excel.
To help with it, the model has a function to export a file called ppr_measure_creator.
1# Use excel_measure creator and gain a file to organize your measures
2model.export_excel_measure_creator()
Excel file ppr_measure_creator.xlsx saved in the folder
An Excel file is saved inside working directory with name ppr_measure_creator.xlsx. Inside this file, the sheet Measure Creator already contains the main column for measure addition.
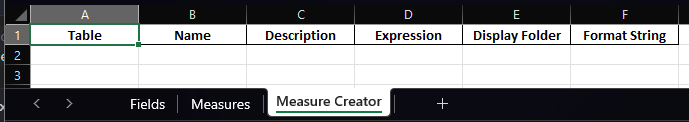
The objective is to facilitate the organization of measures and its addition to model.
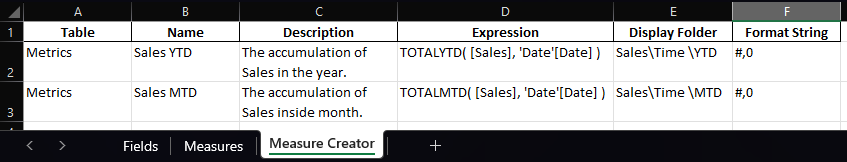
Let’s add some rows into table and show to read it with pandas and interate over.
 1# Import pandas
 2import pandas as pd
 3
 4# Read the sheet
 5df_measure_creator = pd.read_excel('ppr_measure_creator_.xlsx',
 6                                   sheet_name='Measure Creator')
 7
 8# Iterate rows and use it as arguments of add_measure_in_model
 9for idx, row in df_measure_creator.iterrows():
10
11    model.add_measure_in_model(table_name=row['Table'], name=row['Name'],
12                           expression=row['Expression'],
13                           format_string=row['Format String'],
14                           description=row['Description'],
15                           display_folder=row['Display Folder'],
16                           if_exists='delete')
Measure Sales YTD was added in table Metrics in the model
Measure Sales MTD was added in table Metrics in the model
Be aware that not to run the function export_excel_measure_creator again and overwrite the file with measures. I currently rename this file when its created.